
Map
Open Map from the Live screen’s top bar. The map uses OpenStreetMap tiles — no account and no API key — and draws each measurement as an arrow at the position it was taken.
Reading an arrow
Section titled “Reading an arrow”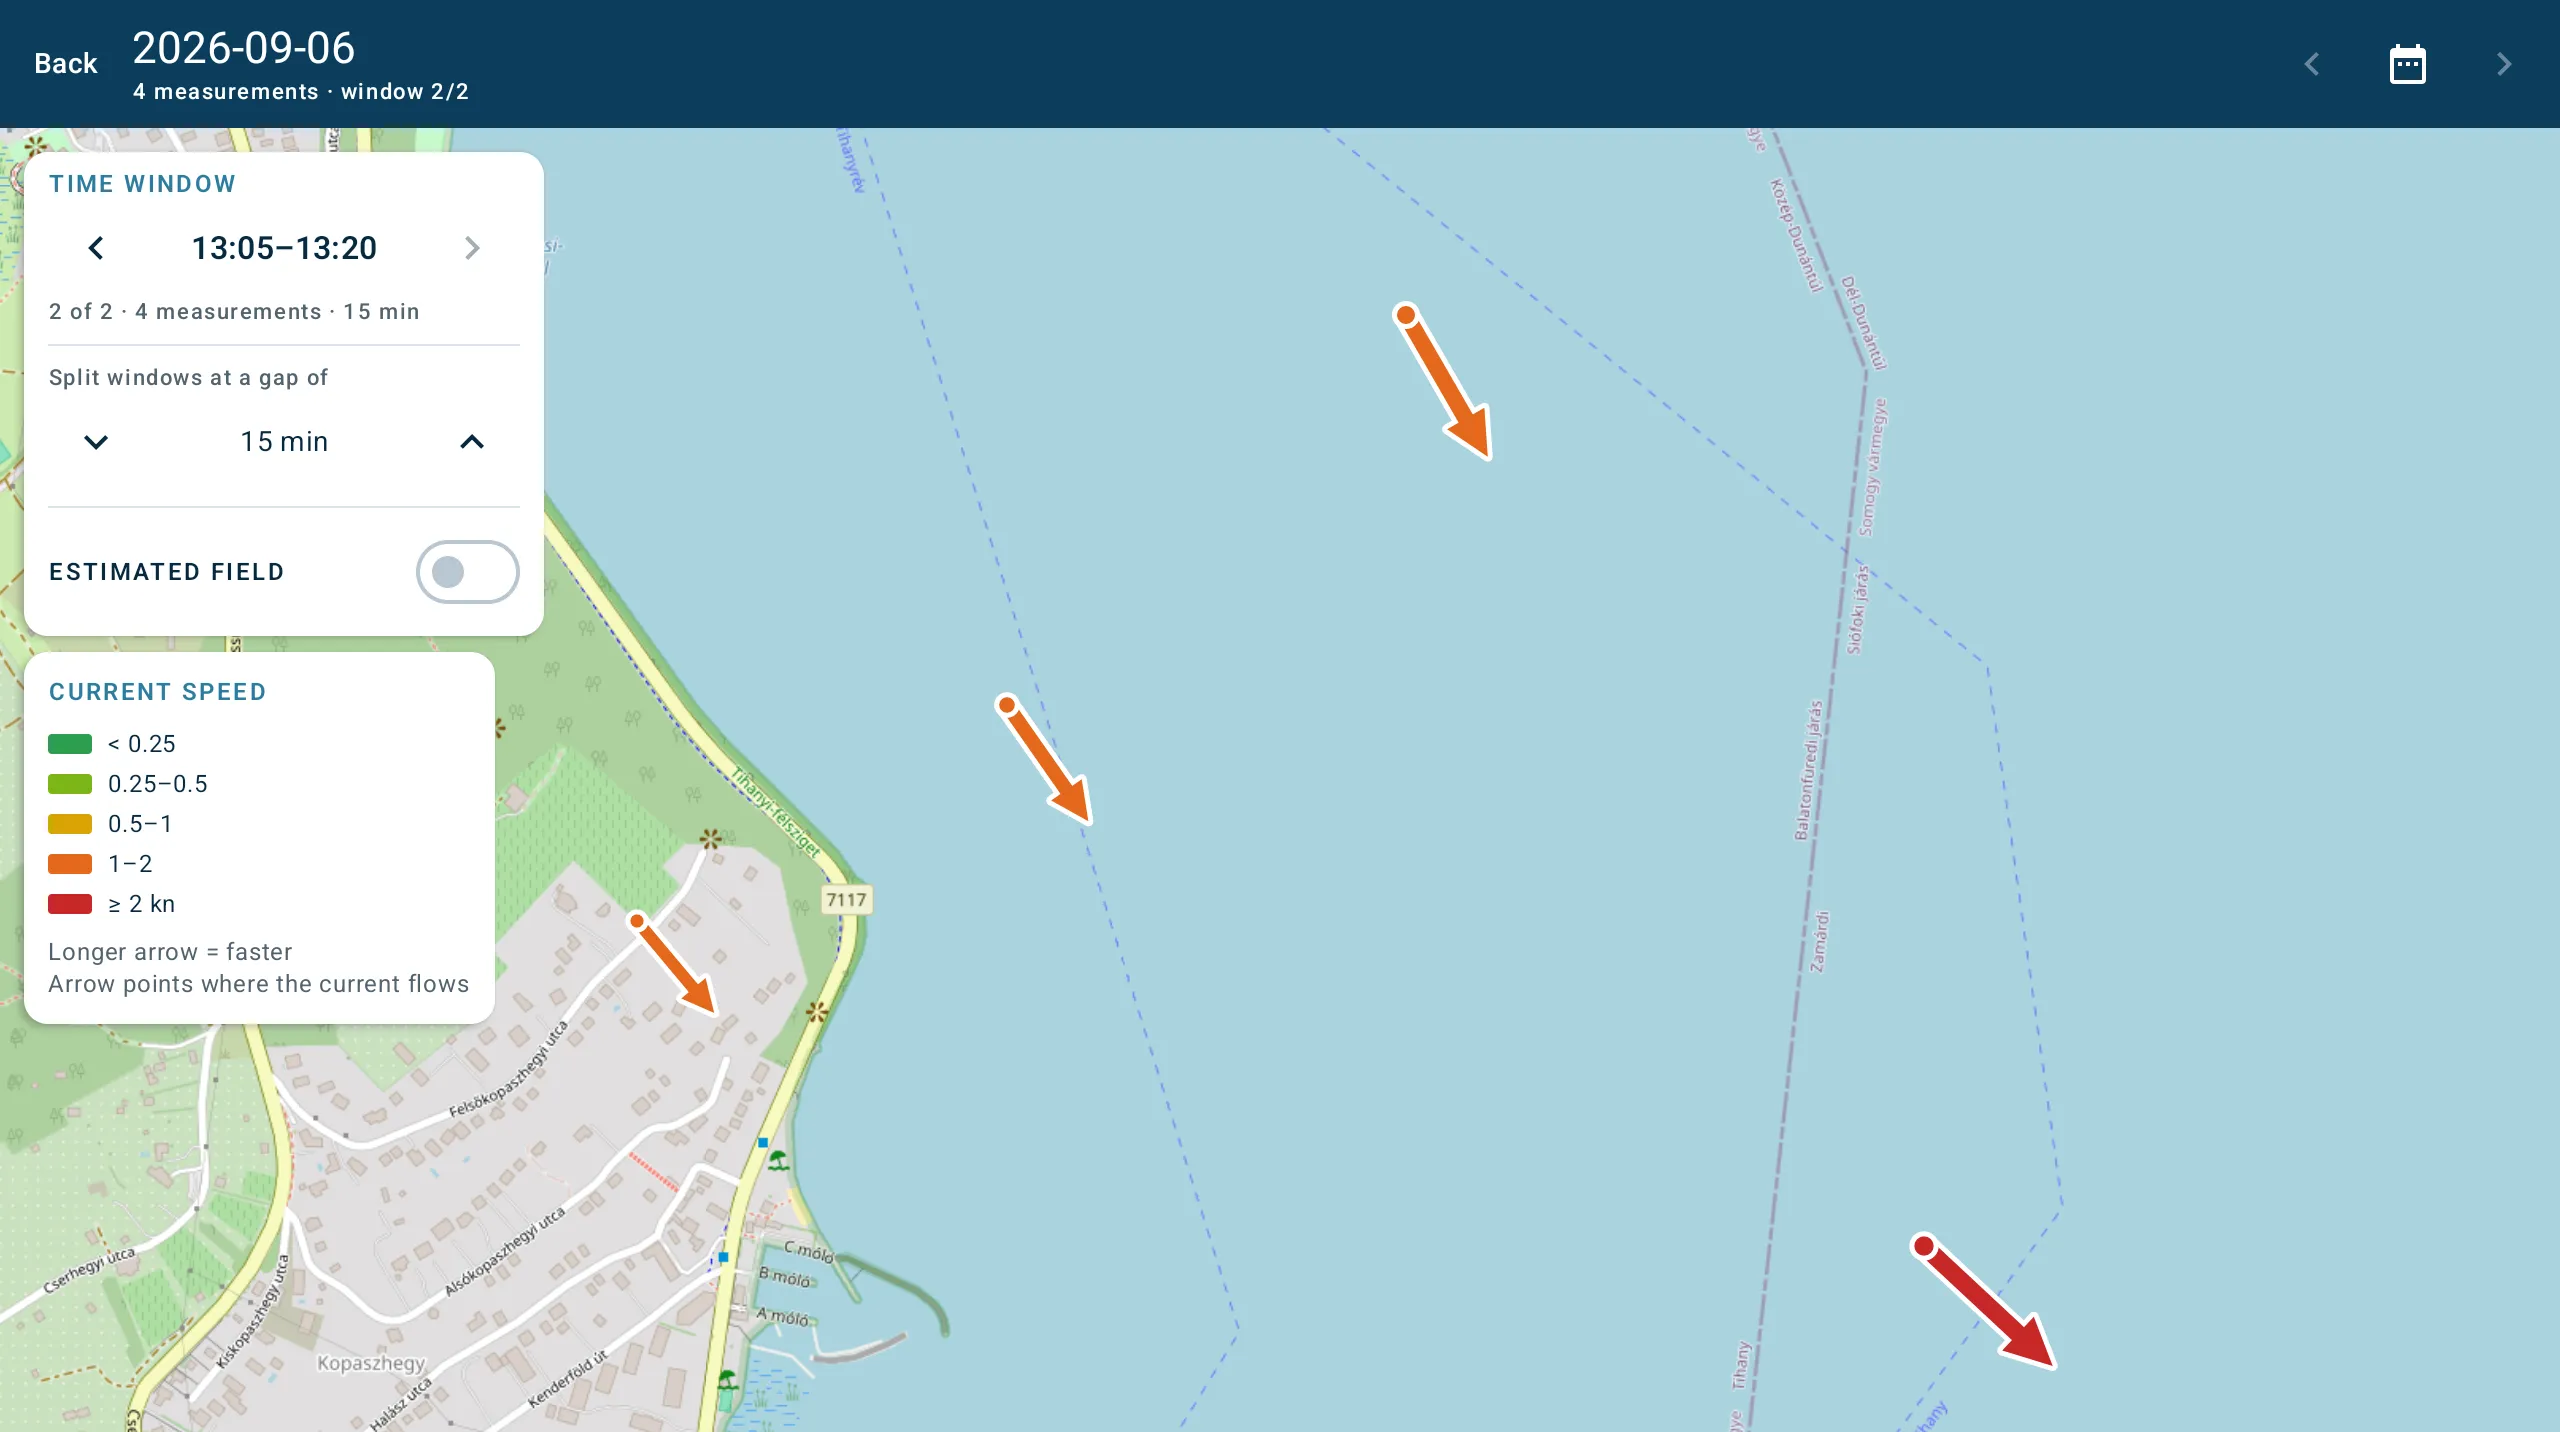
- The arrow points the way the current flows. Always, whatever the buoy’s direction-mode setting says. See how the app words directions.
- Its tail sits on the measurement’s position, marked with a small dot.
- Speed is shown twice — by length, where longer is faster, and by colour:
| Colour | Speed |
|---|---|
| Green | Below 0.25 kn |
| Light green | 0.25 – 0.5 kn |
| Yellow | 0.5 – 1 kn |
| Orange | 1 – 2 kn |
| Red | 2 kn and above |
These bands are the buoy’s own speed bins, so the map groups speeds exactly the way the device does.
Tap an arrow for a card with its time, date, speed in knots and m/min, direction, spread and sample count.
Choosing the day
Section titled “Choosing the day”The top bar carries three controls:
| Control | What it does |
|---|---|
| ‹ | Jump to the previous day that has measurements |
| Calendar | Pick a date — days without data are greyed out |
| › | Jump to the next day that has measurements |
The list of days comes from the buoy’s file listing, so the picker knows which days exist without downloading anything. Choosing a day downloads the files it still needs, and arrows appear one by one as they arrive.
Time windows
Section titled “Time windows”The map shows one time window at a time, never the whole day at once.
This is the single most surprising thing about the map, and it is worth understanding before you conclude that measurements are missing.
A window is a group of measurements taken close enough together to count as one snapshot of the water. A course is usually re-measured in the same places through the day, so drawing every sweep at once would stack readings an hour apart on nearly the same spot with no way to tell them apart.
The TIME WINDOW card is always on the map:
- ‹ 13:05–13:20 › — step between the day’s windows
- 2 of 2 · 4 measurements · 15 min — where you are and what is in this window
- Split windows at a gap of — the stepper, covered below
- ESTIMATED FIELD — the switch, covered below
The top bar echoes it: 4 measurements · window 2/2.
How measurements are grouped
Section titled “How measurements are grouped”A measurement joins the window that is currently open if both of these hold:
- The gap since the previous measurement is no more than the chosen gap, 15 minutes by default, and
- The window has not yet spanned more than 45 minutes.
Otherwise a new window starts.
The gap is always measured against the previous measurement rather than the start of the window. The 45-minute cap is what stops a steady drip of readings chaining together into one endless window.
Changing the gap
Section titled “Changing the gap”The stepper offers 5, 10, 15, 20, 30, 45 or 60 minutes. What counts as one sweep depends on the boat and the course, so this is worth adjusting to how you actually work.
The setting is remembered between sessions. Changing it regroups the day immediately and keeps you on the window still holding the measurement you were looking at, so you do not lose your place.
The estimated current field
Section titled “The estimated current field”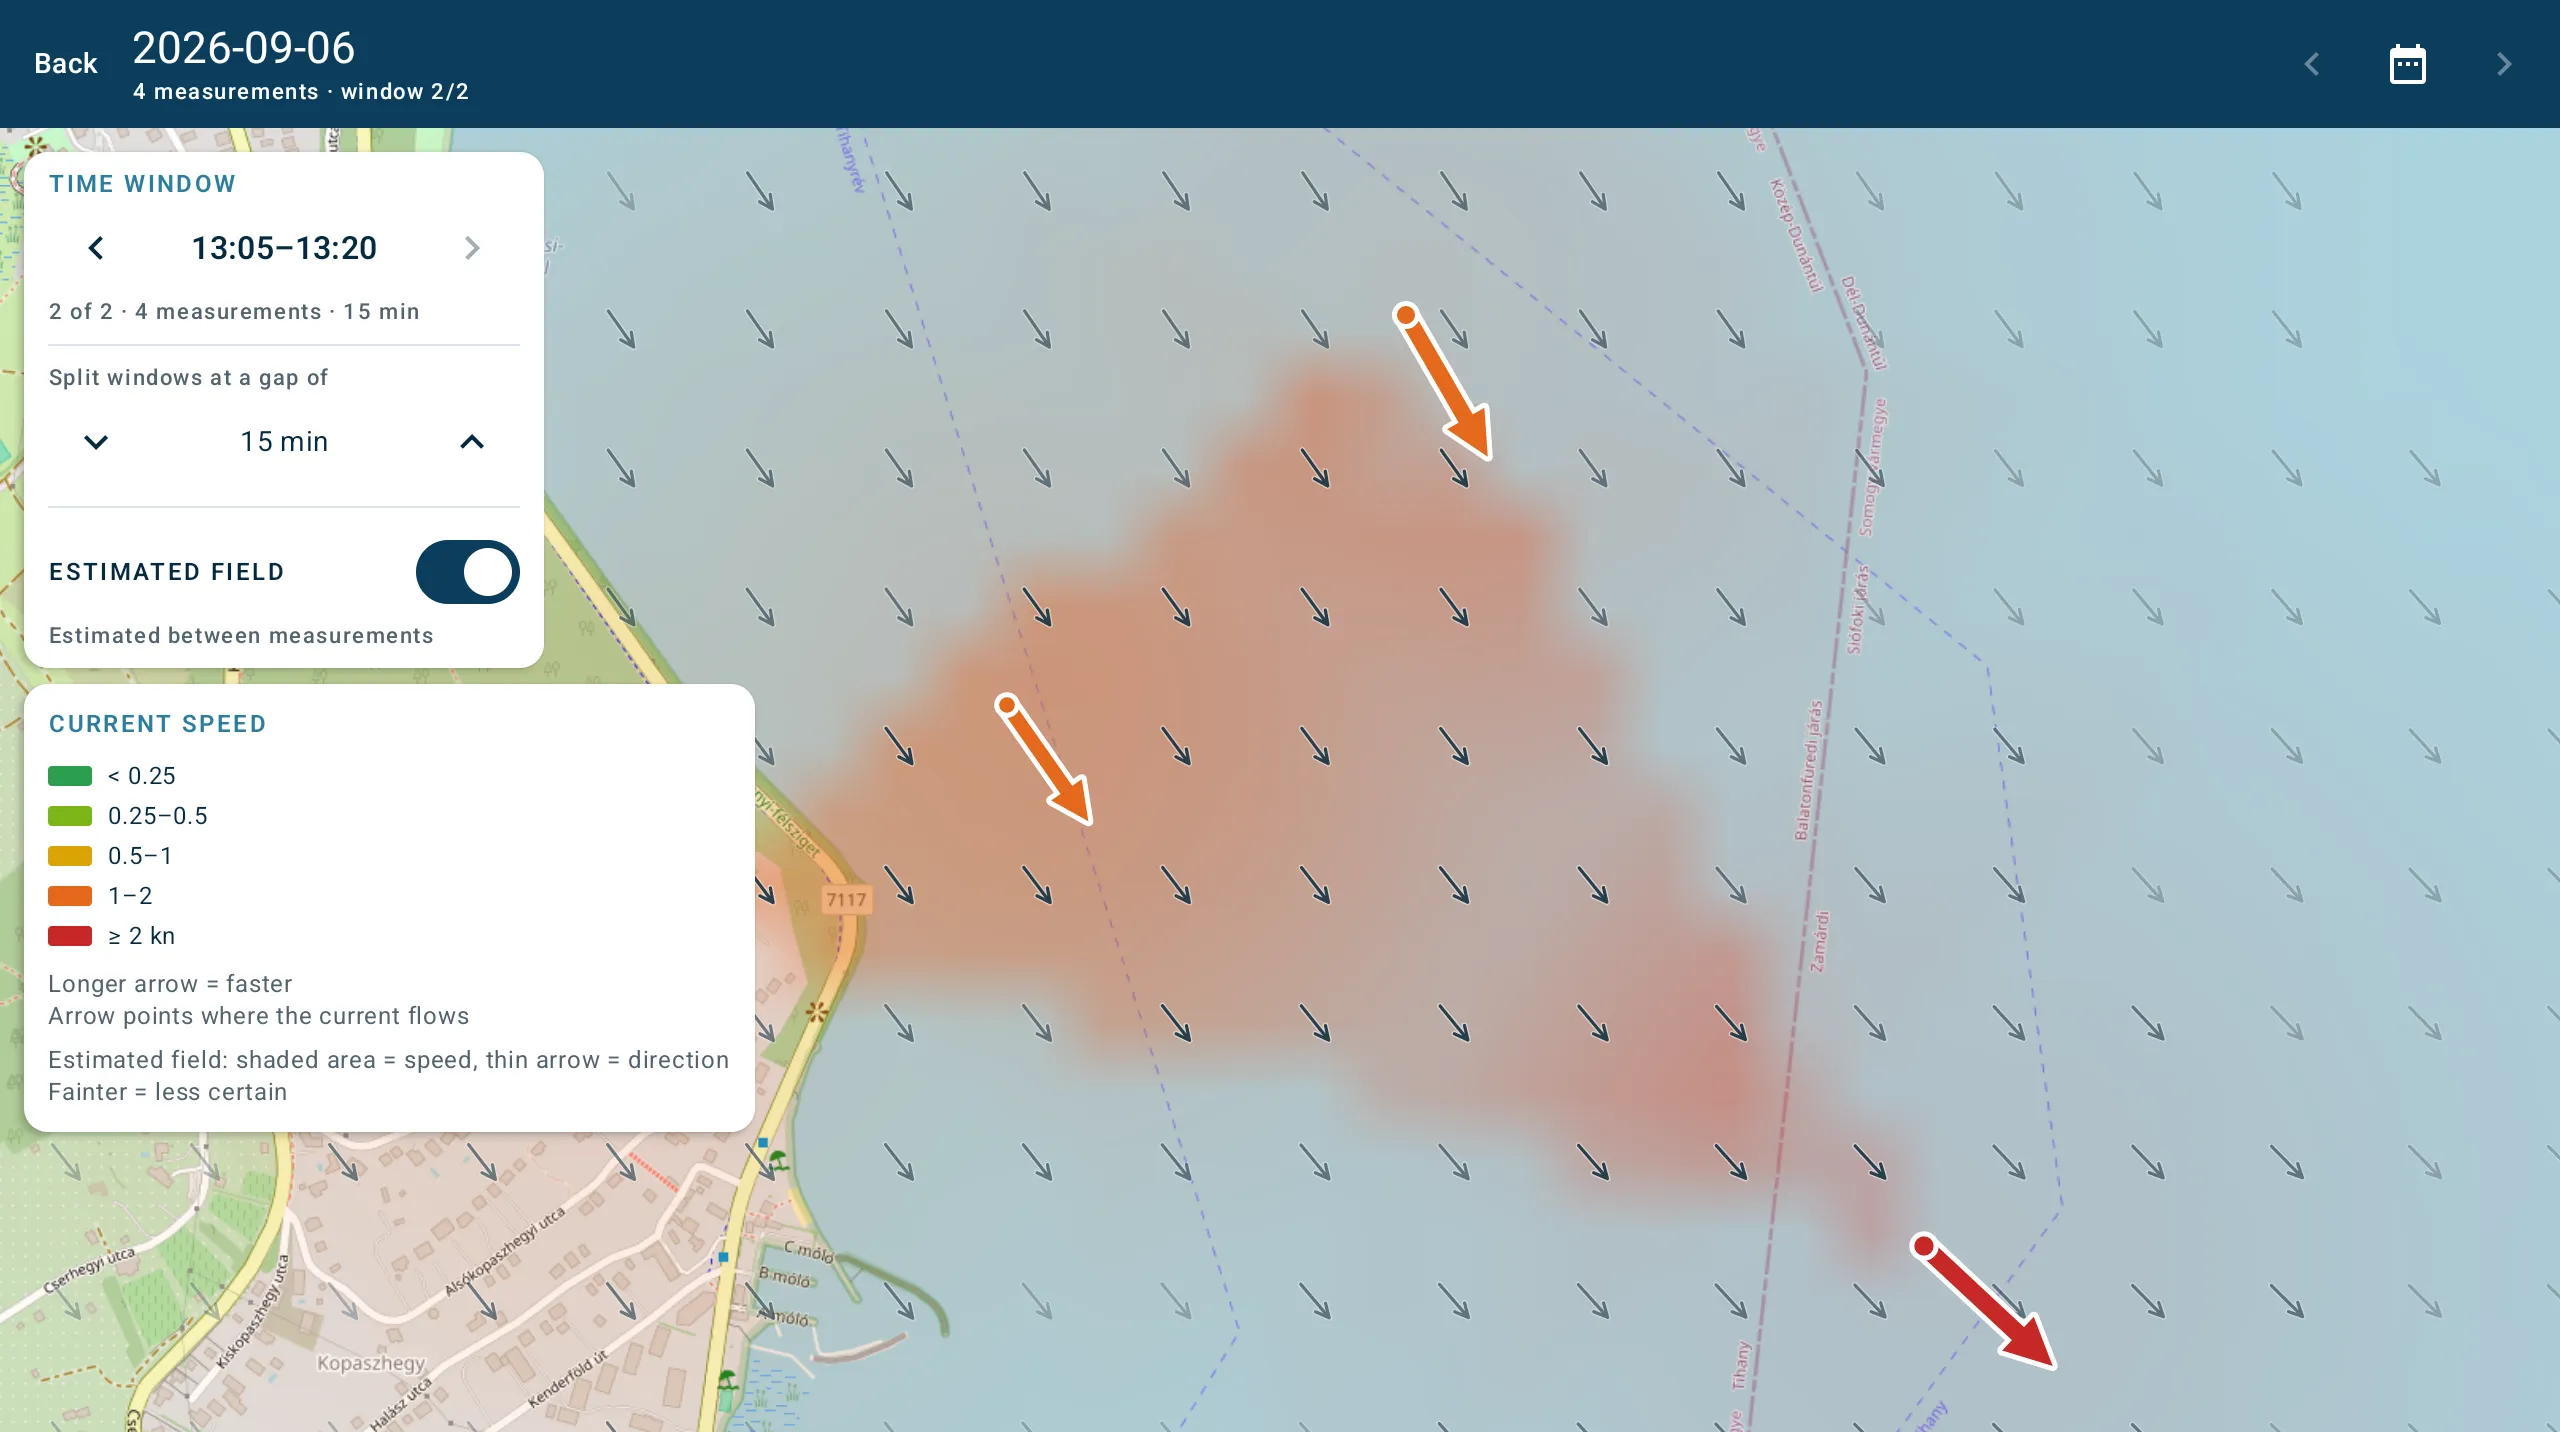
Off by default. Switch it on from the TIME WINDOW card.
It takes the measurements in the window you are looking at and estimates what the current is doing everywhere between them — and slightly beyond — on a 48 × 48 grid.
How to read it
Section titled “How to read it”| What you see | What it means |
|---|---|
| Shaded area | Speed, on the same green-to-red scale as the arrows |
| Thin arrow | Direction only — all the same length, length means nothing here |
| Fainter | Less certain |
| Nothing drawn | No data — the app will not guess this far out |
Confidence falls with distance from the nearest real measurement, with how few measurements are nearby, and outside the area you actually sampled. Beyond roughly twice the typical spacing between your measurements, the app draws nothing at all.
Your measured arrows stay thick, coloured and sized by speed, and are always drawn on top. The two can never be confused: measured arrows are heavy with a solid head, estimated ones are hairlines with an open head.
Zooming out thins the direction arrows so they never become a thicket, and past a point drops them entirely while keeping the speed shading.
When it refuses
Section titled “When it refuses”| Message | Why |
|---|---|
| Needs 3 good measurements — no field | Fewer than three sound, positioned readings in this window |
| Measurements are in a line — no field | The readings lie along a straight line |
Readings along a straight line carry no information about what happens to either side of that line. Inventing some would be exactly the wrong thing to do. Drop the buoy off the line and the field appears.
Both refusals are the app working correctly, not failing.
Next steps
Section titled “Next steps”- Measuring — the Live screen and the direction convention
- Troubleshooting
v1.3.0 · 2026-09-29 · 8e84846