

User Guide
This page covers day-to-day operation. If you have not set the buoy up yet, start with Getting Started. For the buoy’s web pages screen by screen, see the Web Interface page.
What the buoy measures
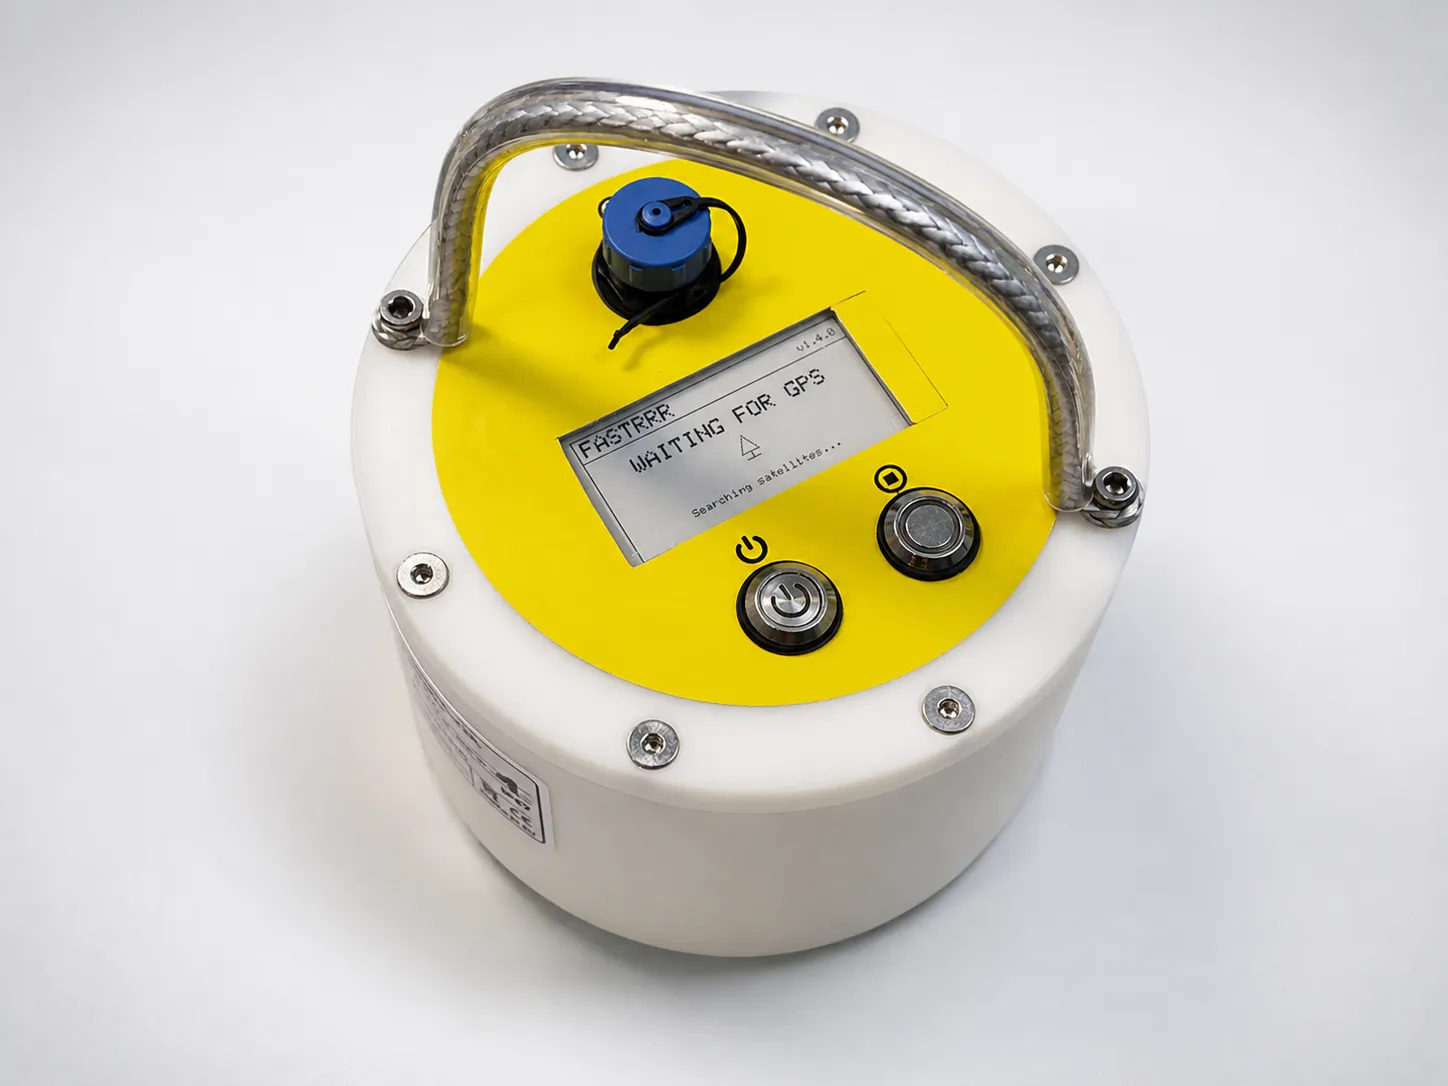
Section titled “What the buoy measures”The DrifterBuoy floats with the current and derives the speed and direction of the current from its own GPS movement. It takes the speed over ground and course over ground reported by the GPS receiver about once a second, and averages them over the measurement window.
This is why the green drogue matters: without it the buoy is pushed by wind and waves, and you measure something other than the current.
The measurement cycle
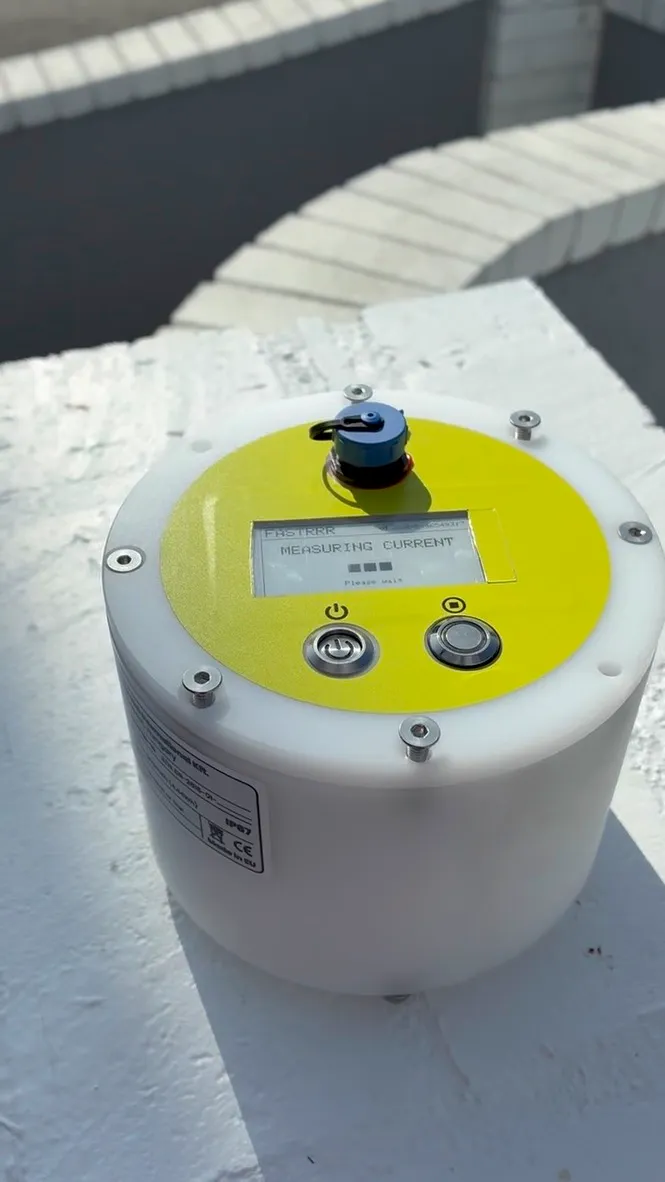
Section titled “The measurement cycle”The buoy moves through a fixed sequence of states, shown on its display and on the web page:
| State | What is happening | What you do |
|---|---|---|
| Searching for GPS | Waiting for the first fix | Wait. A two-tone beep marks the fix |
| Ready to start | Fix acquired, waiting for a start command | Start the measurement |
| Deploy countdown | Grace period before recording begins | Get the buoy into the water |
| Measuring | Recording GPS samples | Let it drift |
| Result | Measurement finished, result on screen | Read the result, or start another |
Once a result is showing, the buoy is ready for the next measurement. You do not need to power cycle between measurements — every measurement gets its own log file.
Starting and stopping
Section titled “Starting and stopping”There are three ways to start a measurement, and all three also stop one:
- The button on the housing — hold it rather than tapping it
- The web page — the Start and Stop buttons on the home page
- The phone app — over Bluetooth
Stop is accepted during the deploy countdown as well as during the measurement. Cancelling the countdown records nothing and returns the buoy to the ready state, which is what you want when you realise the spot is wrong.
Reading a result
Section titled “Reading a result”A finished measurement gives you:
| Value | Meaning |
|---|---|
| Average speed | Mean current speed over the window, in knots |
| Speed deviation | How much the speed varied — a spread figure, not an error bar |
| Average direction | Mean current direction in degrees |
| Direction deviation | How much the direction varied, computed with the Yamartino method |
| Sample count | Number of GPS fixes that passed quality filtering |
The most recent result is shown at the bottom of the home page. Older ones are under Log files, where each measurement has its own entry with charts and a downloadable data file. The Web Interface page shows what each screen looks like.
Valid and invalid results
Section titled “Valid and invalid results”The buoy marks each measurement valid or invalid on its own. A result is invalid when:
- too few usable samples were collected — fixes with poor GPS quality are filtered out, and if what remains falls below the minimum, the measurement does not qualify; or
- the measurement was stopped early, either with the button, from the web page or from the app.
A large deviation figure does not by itself make a result invalid. High spread is information about the water, not a fault — a genuinely turbulent patch produces a wide spread and still counts as a measurement. Treat the deviation as something to interpret, not as a pass/fail mark.
Data and logs
Section titled “Data and logs”Every measurement is written to the SD card as a CSV file, one row per GPS fix:
| Column | Meaning |
|---|---|
sample_no |
Sample number within this measurement |
timestamp |
UTC date and time of the fix |
lat, lon |
Position in decimal degrees |
speed_kn |
Speed over ground, knots |
direction_deg |
Course over ground, degrees |
hdop |
GPS quality figure — lower is better |
satellites |
Satellites used for the fix |
Two header lines at the top of the file give the buoy’s device ID and its firmware version. A summary block is appended to the end of the file after the window closes, holding the averages, the deviations, the sample count and the valid flag.
Files are named LOG_yymmdd_hhmmss.csv after the moment the measurement started,
in UTC — for example LOG_260905_092718.csv. Firmware older than 1.6.0 wrote
LOG_yy-mm-dd_hhmmss.csv.
Files can be downloaded — or deleted — from the Log files page over WiFi, or downloaded through the phone app. The Log files page also shows how much space is left on the SD card.
Settings
Section titled “Settings”The Settings page lets you change:
- Measurement window — how long a measurement records for, 30–600 seconds. New buoys ship with 45 seconds
- Start mode — whether a measurement waits for a start command, or starts by itself as soon as the buoy has its first GPS fix. Automatic start applies to the first measurement after switching on; later ones wait for a start command
- Direction display — whether the direction shown is where the current is flowing to or where it is coming from. This affects the display only; the logged data is always stored the same way, so the setting cannot corrupt your data
- Timezone — by default the buoy works out its own timezone and daylight saving from its GPS position, with no configuration. You can override it manually, which is worth doing close to a timezone border
- Bluetooth — can be switched off entirely for deployments where the app is not used, saving power
Settings changed here are saved on the buoy and survive a restart. The deploy countdown (10 seconds), the minimum sample count and the GPS quality limit are set in the configuration file on the SD card rather than on this page.
Phone app
Section titled “Phone app”The app connects over Bluetooth, alongside the WiFi network rather than instead of it. It shows live GPS data, downloads saved measurements, and starts and stops measurements. One phone can be connected at a time.
Maintenance
Section titled “Maintenance”- Keep the charging connector closed and sealed whenever the unit is not charging
- Rinse with fresh water after use in salt water
- Charge every three to four days in active use; charge before long storage
- Check the drogue and its safety cord for damage before each outing
v1.3.0 · 2026-09-29 · 8e84846